Data Analytics
SA Housing Analytics
Comparing rental pressure, population growth and housing approvals across South Australian local areas through Streamlit and Power BI.
At a glance
The project in a minute.
- The problem
- Rental, population, income and approval data are difficult to compare consistently across South Australian local areas.
- My contribution
- Built the data pipeline, weighted screening index, Streamlit dashboard and Power BI semantic model and report.
- The output
- An interactive dashboard and six-page Power BI report, with comparison views and visible data-quality limitations.
Problem
Housing evidence is spread across separate rental, population, income and building-approval datasets, making local areas difficult to compare consistently.
Objective
Create a reproducible decision-support dashboard that compares rental-cost pressure, population growth and approved housing supply across South Australian local government areas.
Hugh’s role
Hugh built the data pipeline, transparent scoring model, Streamlit dashboard, Power BI semantic model and report, comparison views, automated data-quality checks and supporting documentation.
Data and approach
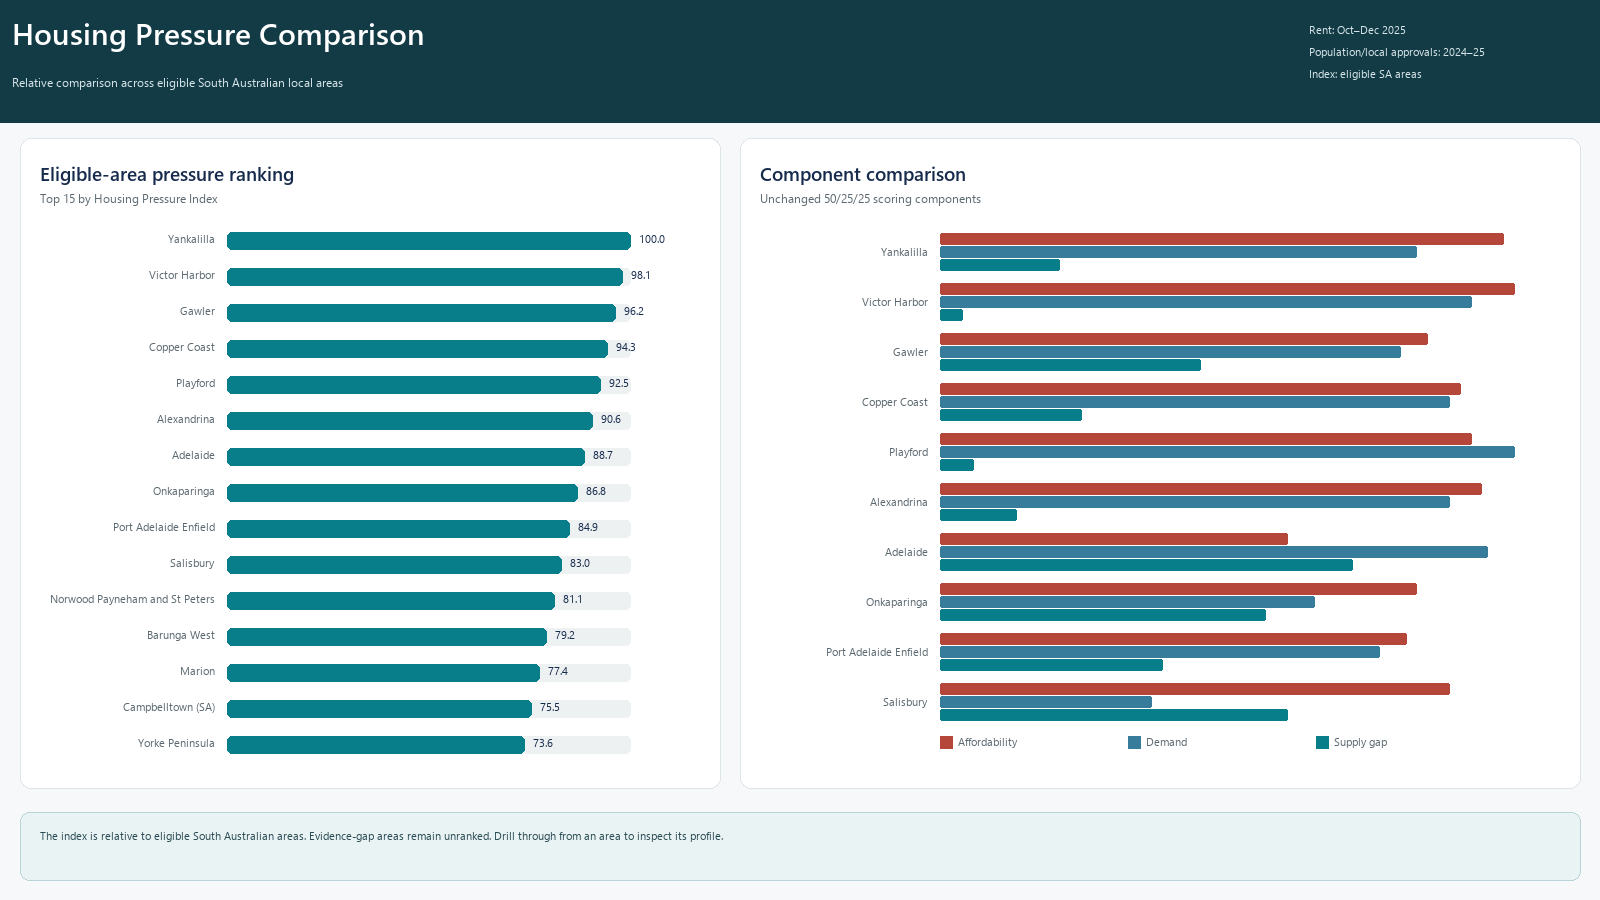
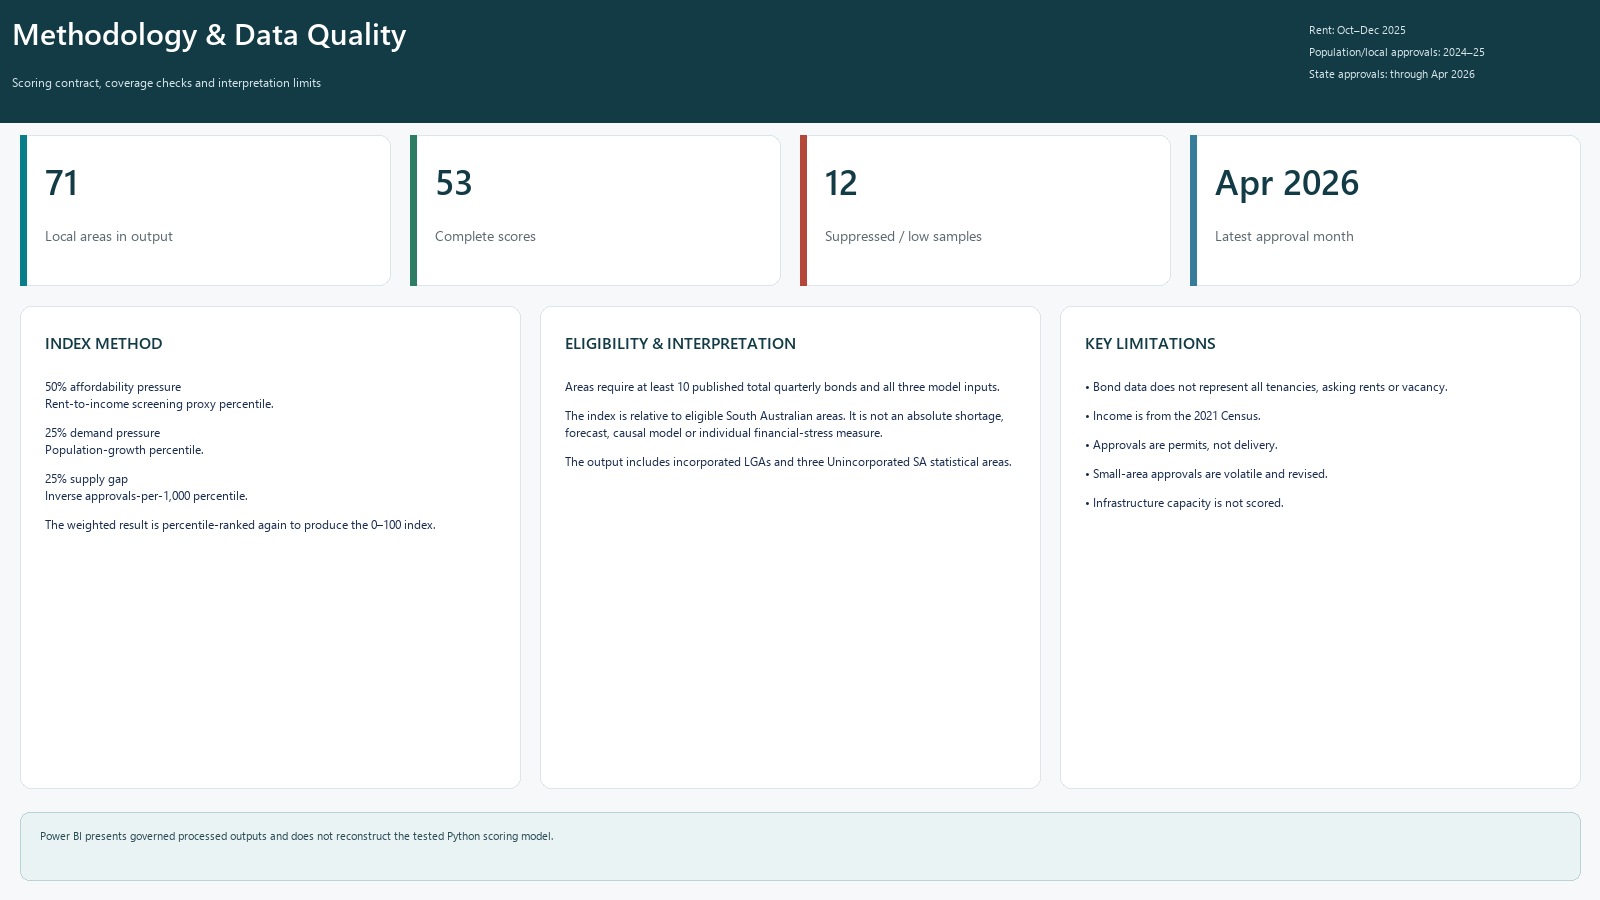
The project integrates documented data from the SA Housing Trust and Australian Bureau of Statistics. It uses a transparent weighted index covering affordability pressure, population growth and dwelling approvals per 1,000 residents. Versioned screening rules and data definitions make the analysis reproducible and reviewable.
Power BI portfolio version
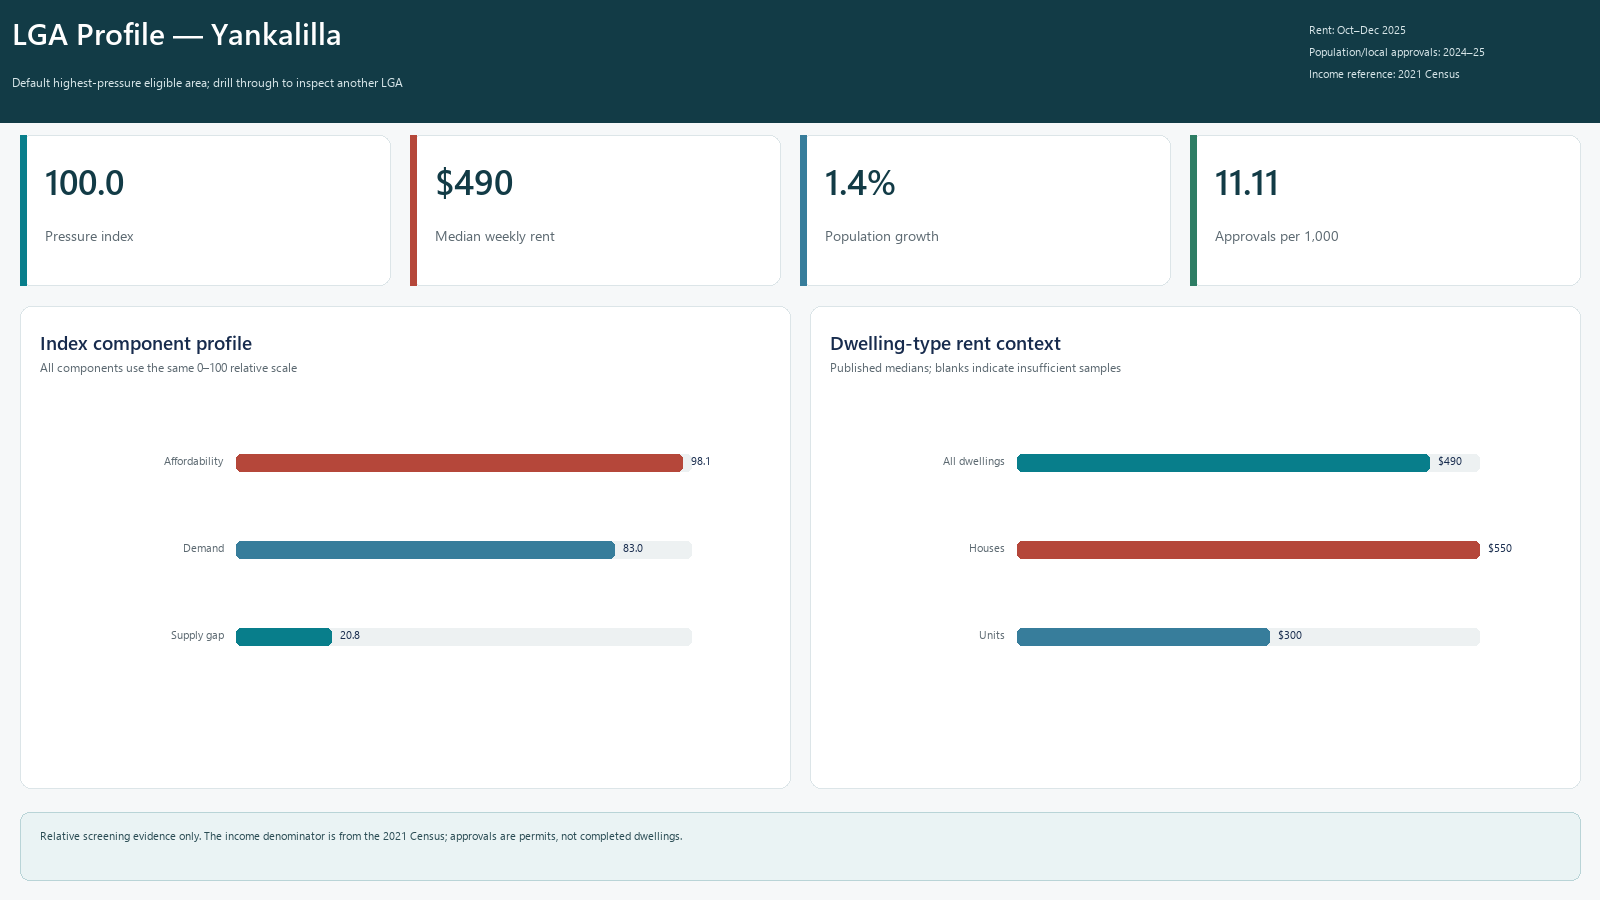
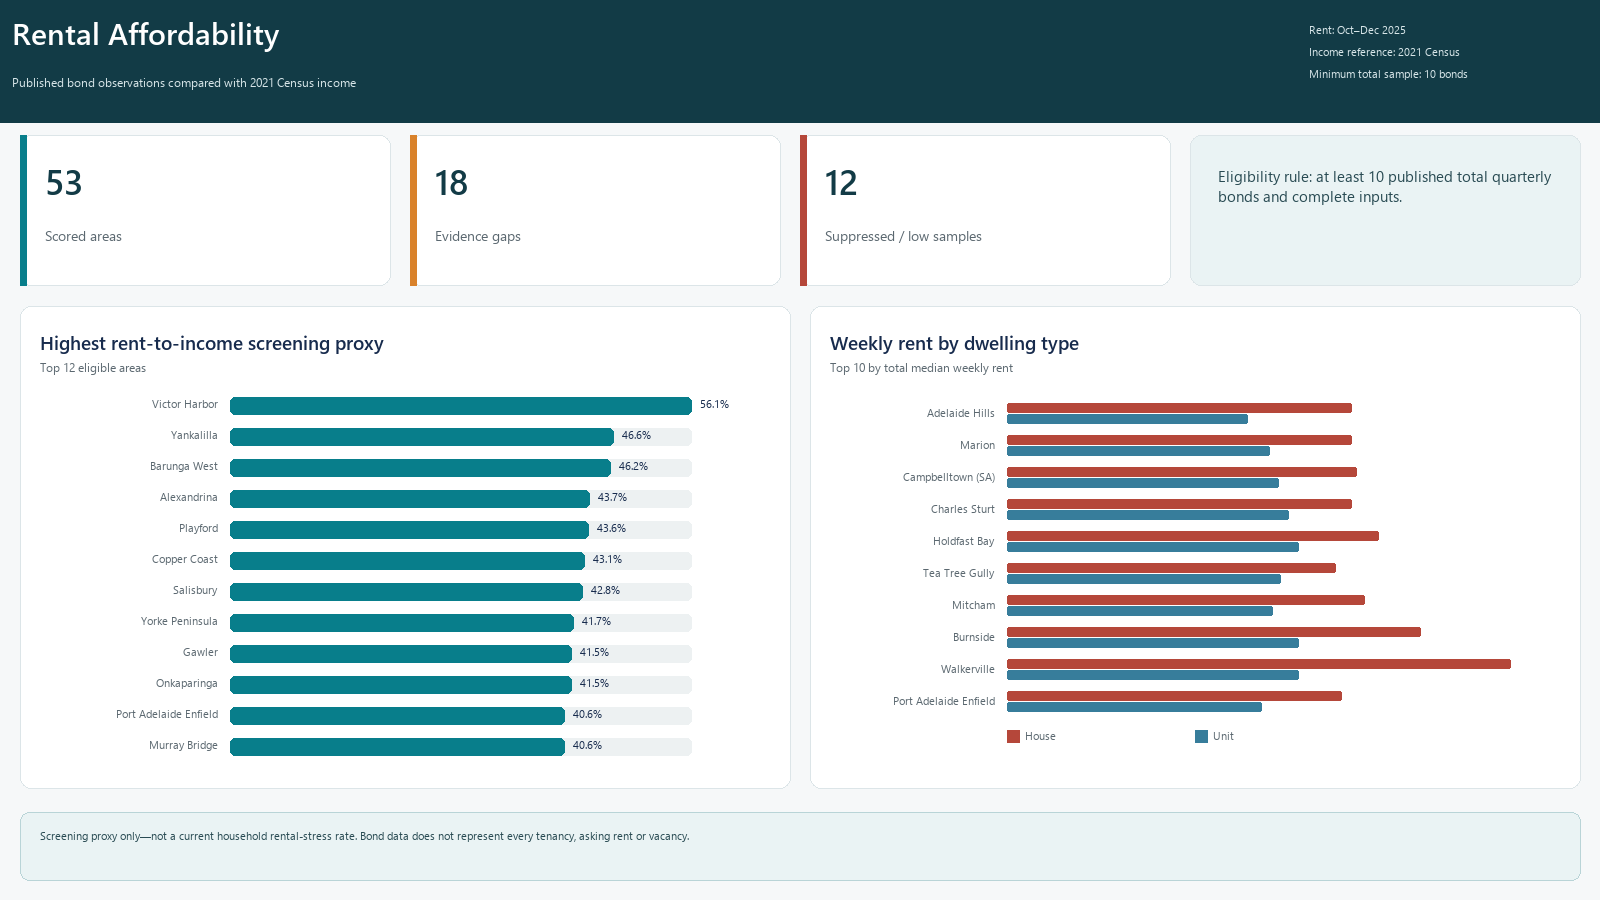
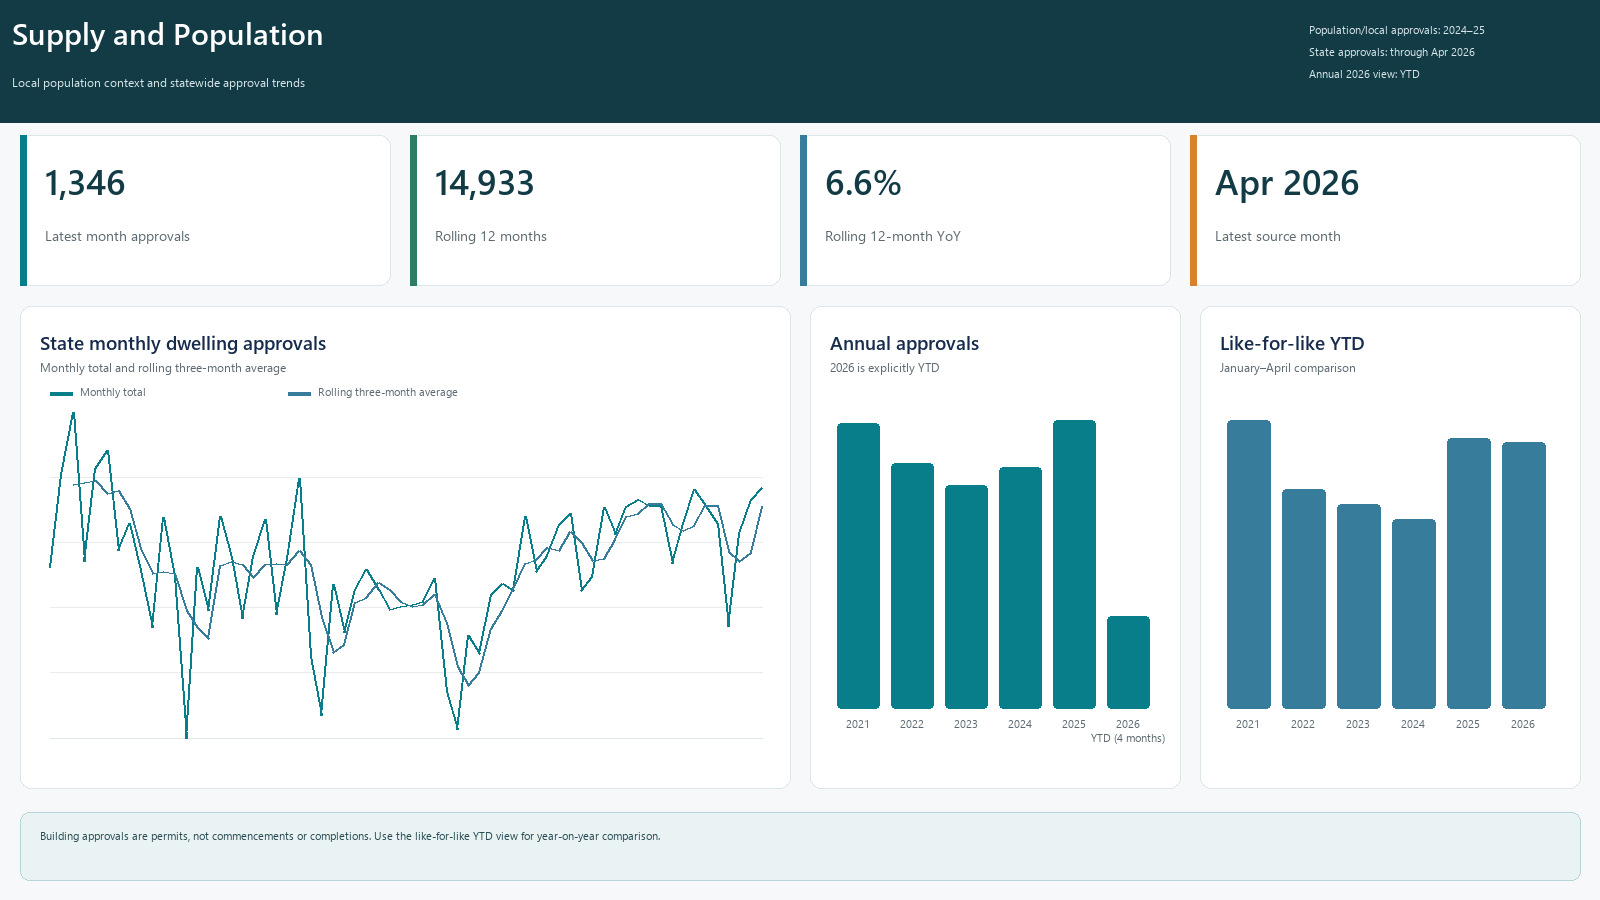
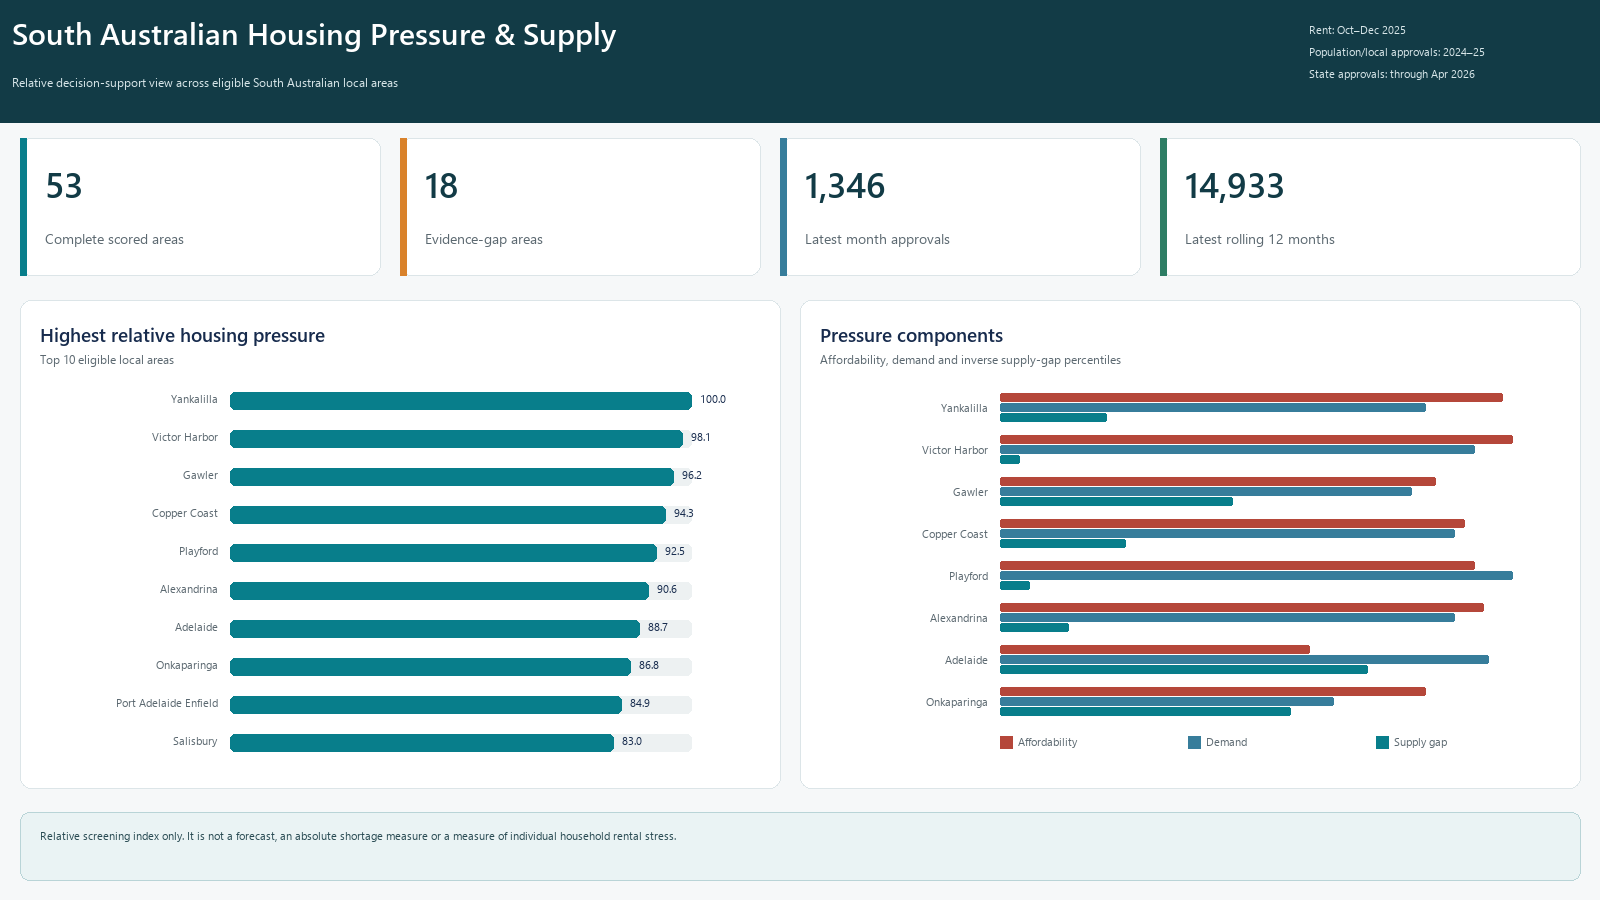
The source-controlled Power BI Project imports the governed pipeline outputs through Power Query and uses a star schema, explicit DAX measures and six report pages. The report covers an executive overview, pressure comparison, drill-through LGA profile, rental affordability, supply and population, and methodology and data quality.
Power BI does not reconstruct the index. The tested Python pipeline remains the analytical source of truth, while Power BI provides the semantic, calculation and presentation layers.
Output
The public dashboard presents ranked results, supporting local context and
side-by-side comparison views. The portfolio also presents exported Power BI
report pages and a short walkthrough. The source repository includes the
reviewable .pbip project, PBIR report definitions, TMDL semantic model, Power
Query imports, DAX measures, processing pipeline, tests and documentation.
Business value
The dashboard provides a consistent starting point for investigating relative housing pressure while keeping evidence gaps and model assumptions visible. It is a screening tool, not a forecast, shortage finding or policy recommendation.
Limitations
- Rental data represents published bond activity for a quarter, not all tenancies or asking rents.
- The income denominator uses 2021 Census data and is a screening proxy rather than a current rental-stress measure.
- Building approvals do not prove that construction commenced or that dwellings were completed.
- Infrastructure capacity is not included in the score.
Report tour
Power BI walkthrough
An 18-second walkthrough of the six-page Power BI portfolio report.
Visual evidence
Project screenshots
Select any screenshot to open the full-size view.