Data Analytics
Australian Visa Fee Dashboard
A source-linked Streamlit dashboard for exploring selected Australian visa application charge changes, policy context and evidence limits.
At a glance
The project in a minute.
- The problem
- Scattered fee records and policy sources make selected Australian visa charge changes difficult to compare and trace.
- My contribution
- Built the research ledger, Python cleaning pipeline, interactive charts and source-linked Streamlit dashboard.
- The output
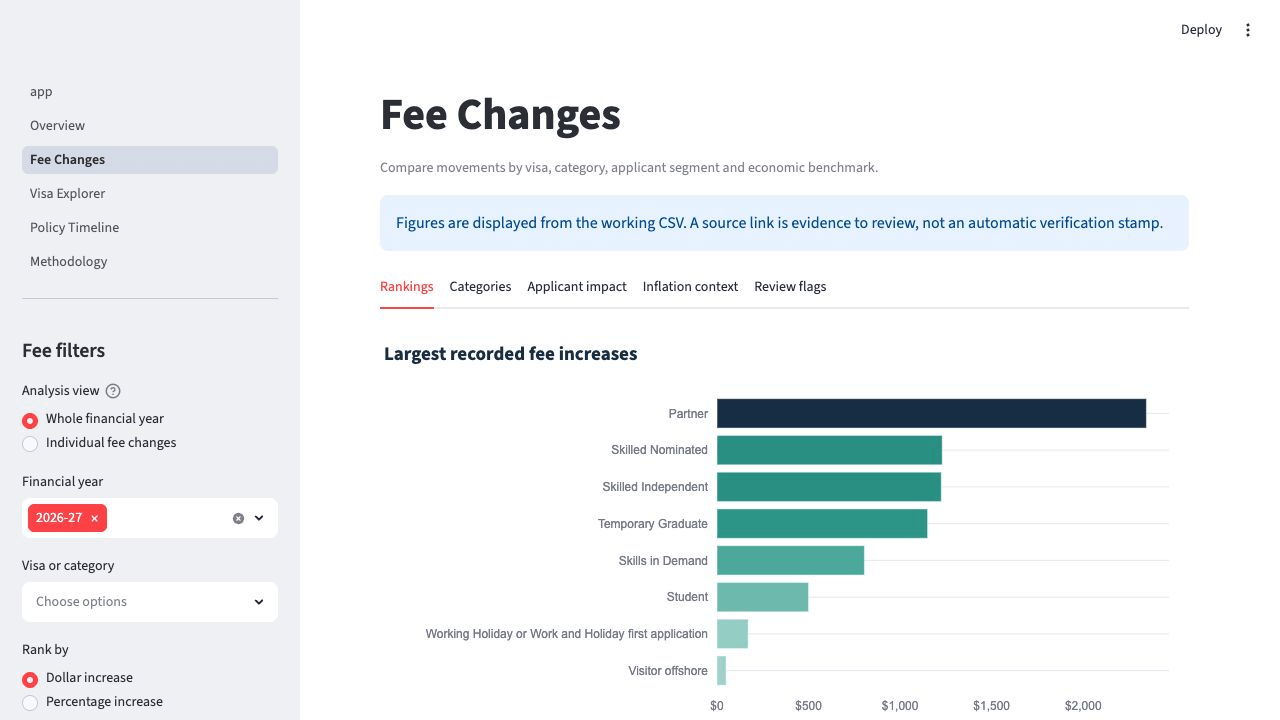
- Five dashboard pages covering fee changes, record exploration, policy context and methodology, with evidence caveats.
Problem
Australian visa application charge information is spread across legislative instruments, Home Affairs pages, policy announcements and historical references. That makes it difficult to compare selected fee changes consistently or explain where the evidence is strong, incomplete or only contextual.
Objective
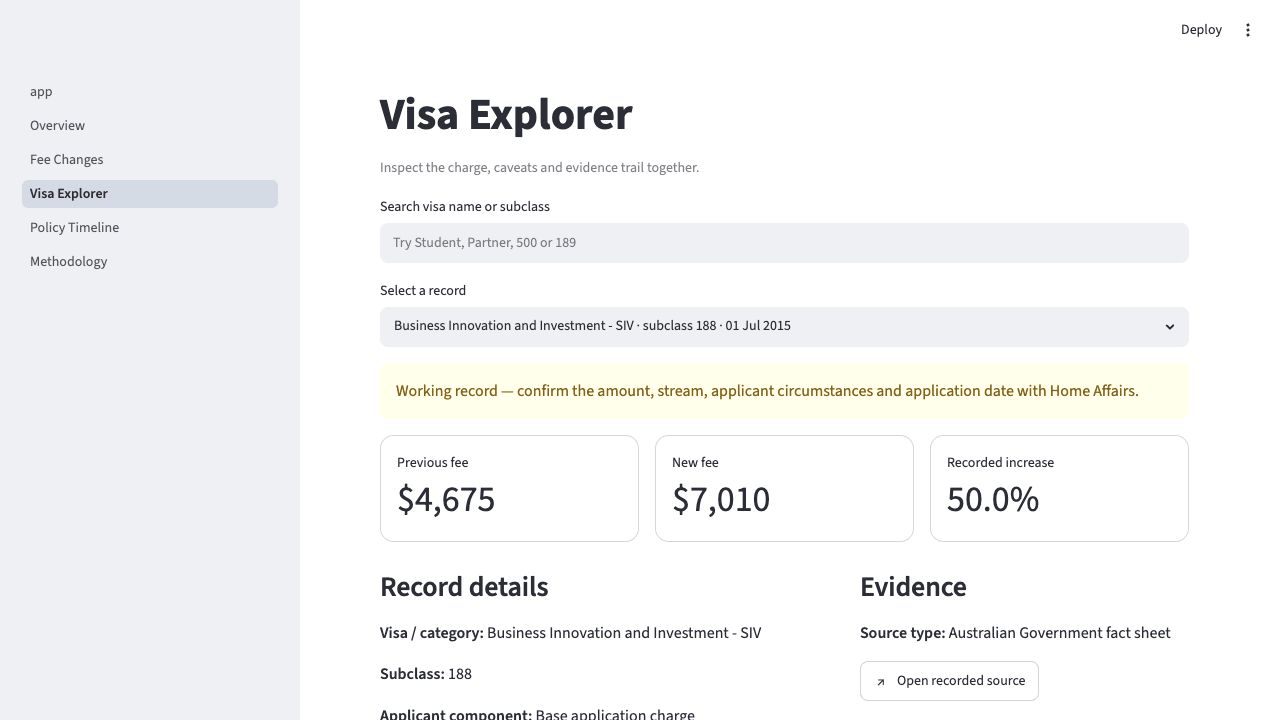
Create a transparent analytical dashboard that helps users explore selected Australian visa application charge changes by visa, subclass, charge component and effective date.
The dashboard is designed to answer four practical questions:
- Which recorded visa charges changed, and by how much?
- How do selected changes compare across visas and financial years?
- Which movements appear unusual relative to the recorded history or a CPI benchmark?
- What policy context is relevant without presenting correlation as cause?
Hugh’s role
Hugh built the research ledger, reusable Python cleaning pipeline, processed datasets, Streamlit interface, Plotly charts, methodology notes and automated tests.
Data and approach
The project prioritises Australian Government sources, including Federal Register instruments, explanatory statements and Department of Home Affairs pages. The data model keeps fee observations, annual policy records and source metadata separate so dashboard views can distinguish facts from derived comparisons.
The Python pipeline validates fields, standardises dates and categories, recalculates dollar and percentage movements, and preserves provenance for each non-sample record. Processed outputs support historical fee trends, rankings, CPI comparison, anomaly flags, applicant-segment mapping, affordability scenarios and a policy timeline.
Output
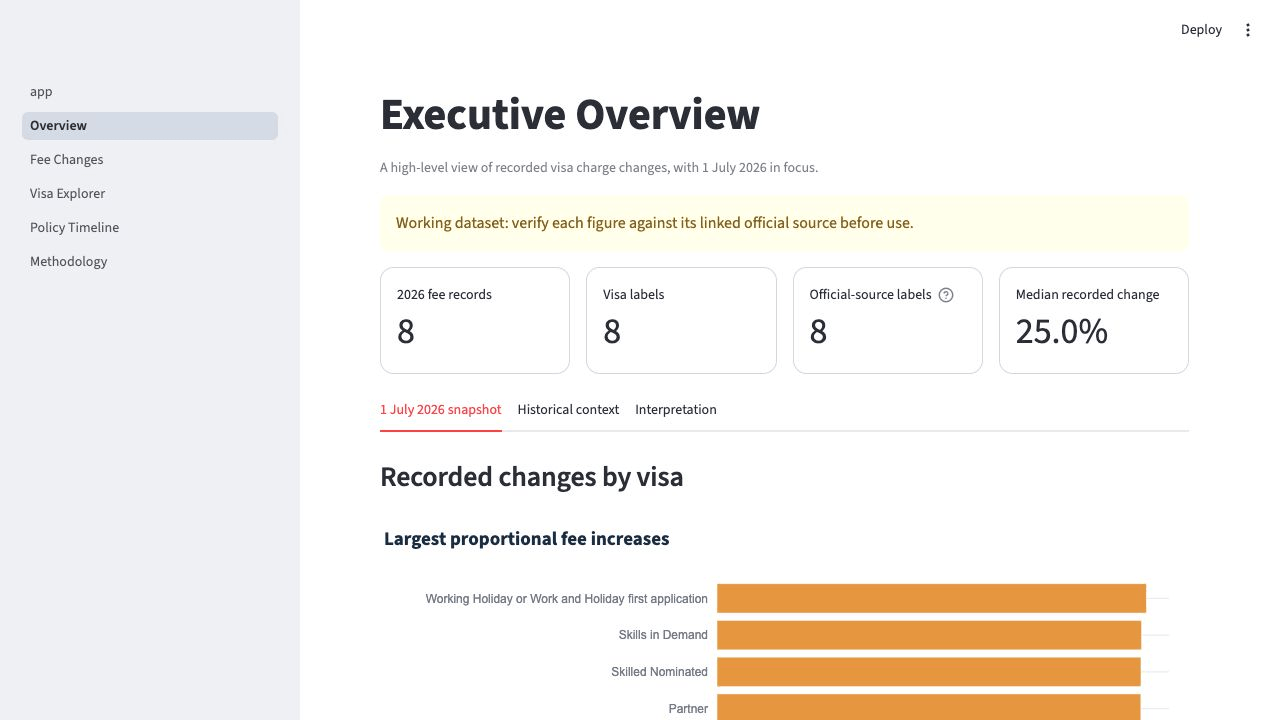
The Streamlit application includes a landing page plus five dashboard pages: executive overview, fee changes, visa explorer, policy timeline and methodology. The project folder also includes data-quality notes, analysis summaries, source logs and automated tests.
The current dataset contains 73 visa-fee rows and 5 policy rows after cleaning. Project QA notes report that the automated suite passed and that six Streamlit entry points loaded without exceptions.
Selected findings
- Eight selected visa charge records effective 1 July 2026 increased by about 25%.
- The recorded additional base-fee amounts range from A$50 to A$2,345.
- The selected increases sit about 20 percentage points above Treasury’s 5.0% June-quarter 2026 CPI forecast, but that comparison does not explain why fees changed.
- Student 500 in July 2024 and Temporary Graduate 485 in March 2026 are the largest percentage review flags in the selected historical ledger.
Business value
The dashboard demonstrates a complete analyst workflow: source logging, data cleaning, repeatable calculations, interactive exploration, evidence caveats and clear communication of uncertainty. It is suitable for portfolio review because it shows both the analysis and the judgement used to avoid overstating the data.
Current status
The public Streamlit dashboard is available for review. The project remains framed as an analytical portfolio tool, with evidence caveats kept visible so users do not treat it as a complete official fee schedule or migration advice.
Limitations
- The ledger covers selected representative records, not the full official visa fee schedule.
- Some current Home Affairs pages are mutable and should be strengthened with dated primary evidence where possible.
- Missing historical years are not estimated and do not prove that no fee change occurred.
- CPI is a contextual comparator, not a measure of visa-processing cost.
- The dashboard is analytical information only and is not legal, migration or fee-calculation advice.
Next steps
- Complete desktop, tablet and mobile visual QA.
- Strengthen the dated primary evidence for every 2026 old/new fee pair.
- Re-run source-link checks when the dataset changes.
Visual evidence
Project screenshots
Select any screenshot to open the full-size view.